We have compiled a list of manufacturers, distributors, product information, reference prices, and rankings for soft.
ipros is IPROS GMS ・ IPROS One of the largest technical database sites in Japan that collects information on.

soft(File Server) - List of Manufacturers, Suppliers, Companies and Products | IPROS GMS

Last Updated: Aggregation Period:Sep 16, 2026~Oct 13, 2026
This ranking is based on the number of page views on our site.

soft Product List

1~12 item / All 12 items

Displayed results

Software "SECUDRIVE File Server"

High-security, low-cost, and highly convenient file server security software!

"SECUDRIVE File Server" is a security software that protects Windows file servers with powerful DLP (Data Loss Prevention) features and can isolate confidential data within the file server from ransomware. It only requires installing the software on the file server or client PCs currently in use, so there is no need for new capital investment. You can utilize standard Windows features such as user permissions, folder sharing, file management, and Active Directory as they are. 【Features】 ■ Data leakage prevention ■ Ransomware blocking ■ Integration with standard Windows features ■ File operation log management ■ Support for cloud server environments (EC2, Azure) ■ Easy to implement and operate without additional servers *For more details, please refer to the PDF document or feel free to contact us.

  • Software (middle, driver, security, etc.)
  • Other security
  • soft

Added to bookmarks

Bookmarks list

Bookmark has been removed

Bookmarks list

You can't add any more bookmarks

By registering as a member, you can increase the number of bookmarks you can save and organize them with labels.

Free membership registration

HPGL/Vector/Image Printer PloCon

PloCon continuously prints drawings of various graphic files

PloCon reads HPGL/Vector/Image file continuously and outputs it to Windows printer. If there is PloCon, even if there is no expensive plotter, it can output to Windows printer efficiently in large quantities.

  • Other CAD related software
  • soft

Added to bookmarks

Bookmarks list

Bookmark has been removed

Bookmarks list

You can't add any more bookmarks

By registering as a member, you can increase the number of bookmarks you can save and organize them with labels.

Free membership registration

MaxGauge for JAVA

Collect profiling information with minimal overhead! You can see everything about the operation of your JAVA application.

"MaxGauge for JAVA" is a web application server profiling tool that collects profiling information with minimal load (CPU < 1%) through its uniquely implemented SFP (Super Fast Profiling) feature, allowing for continuous data collection. It differentiates itself from other solutions that temporarily limit data collection to specific packages. It also enables the collection of execution history for all user classes, excluding the Simple Method. Additionally, it features an easy-to-understand and intuitive interface, allowing for faster and more accurate information retrieval. 【Features】 ■ Information collection without application changes ■ 100% collection of transaction information ■ Analysis by linking JAVA-DB transactions ■ Low-load information collection without impacting application performance *For more details, please refer to the PDF document or feel free to contact us.

Added to bookmarks

Bookmarks list

Bookmark has been removed

Bookmarks list

You can't add any more bookmarks

By registering as a member, you can increase the number of bookmarks you can save and organize them with labels.

Free membership registration

Master Stack "EtherCAT Master"

For a variety of (real-time) operating systems! It has high performance and reliability.

The "EtherCAT Master" is a versatile EtherCAT master stack for configuring and managing EtherCAT networks, as well as for regular process data exchange. It features an advanced API that allows for a consistent interface between applications and the EtherCAT master stack across all operating systems. Additionally, it is equipped with detailed diagnostic and profiling capabilities, making it compatible with common (real-time) operating systems. 【Features】 ■ Written in ANSI-C, achieving high performance, low resource usage, and excellent scalability ■ The core components of the stack software are independent of the operating system and CPU architecture ■ EtherCAT Master Class A compliant with ETG.1500 *For more details, please refer to the PDF documentation or feel free to contact us. *An English version of the catalog is available for download.

  • Company:Renas
  • Price:Other
  • Server monitoring and network management tools
  • Other network tools
  • soft

Added to bookmarks

Bookmarks list

Bookmark has been removed

Bookmarks list

You can't add any more bookmarks

By registering as a member, you can increase the number of bookmarks you can save and organize them with labels.

Free membership registration

SIMULIS THERMODYNAMICS

Thermodynamic property estimation software that can be used from Excel add-ins and MATLAB toolboxes.

SIMULIS THERMODYNAMICS is a product of the French company Fives ProSim. It allows for the precise estimation of thermodynamic properties and phase equilibrium states for plant engineering, and can be used as a Thermodynamic Calculation Server accessible from Excel add-ins and MATLAB toolboxes. There are over 30 model equations available for both equation of state models and liquid phase activity coefficient models, along with a standard database of pure substance data (DIPPR) and a Binary Interaction Parameter database. It is also capable of estimating pure substance properties and mixture phase equilibrium properties using the group contribution method. It complies with the Cape-Open standard, allowing integration with other general-purpose simulators and the incorporation of other property estimation software.

  • simulator
  • soft

Added to bookmarks

Bookmarks list

Bookmark has been removed

Bookmarks list

You can't add any more bookmarks

By registering as a member, you can increase the number of bookmarks you can save and organize them with labels.

Free membership registration

| Visualization of sensor values with easy management | Manager software

This is a manager software compatible with the Modbus protocol that achieves energy saving and improvements in productivity and quality.

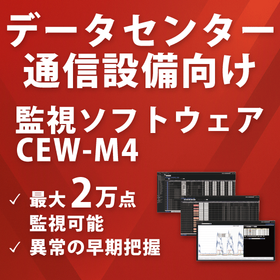
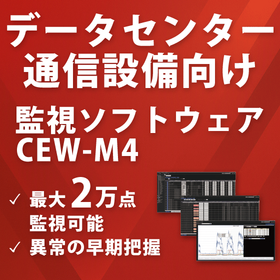
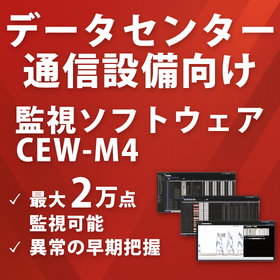
The "CEW-M4" is a manager software compatible with the Modbus protocol that visualizes the values of various sensors and multimeters, achieving energy savings and improvements in productivity and quality. You can implement a power monitoring system that allows for easy setup and operation from the user's perspective. 【Three Key Points】 1. Various functions such as virtual sensors, comparison graphs, and map displays can be easily operated from a web browser. 2. You can efficiently manage a large number of sensors, including bulk registration via CSV files. Additionally, since most settings can be done by the operational administrator themselves, there is no need for vendor configuration changes, which can reduce costs. 3. It can accommodate up to 20,000 sensors, allowing for a wide range of system construction from small to large scale. For more details, please download the materials or feel free to contact us. | We also offer a lineup of various sensors, including AC current sensors and temperature and humidity sensors. |

  • 図版?複数拠点や複数サイトを管理できます_1.jpg
  • 図版?複数拠点や複数サイトを管理できます_2.jpg
  • 図版?四則演算可能な仮想センサーでPUE算出も可能.jpg
  • 図版?計測値をグラフで比較、問題点や改善を見える化.jpg
  • 図版?現場の異常を素早くメール送信.jpg
  • 専用マネージャーソフトを使用した一元監視システム.png
  • 専用マネージャーソフトを使用した一元監視システム.png
  • Other energy equipment
  • Power Monitoring Equipment
  • Other server related
  • soft

Added to bookmarks

Bookmarks list

Bookmark has been removed

Bookmarks list

You can't add any more bookmarks

By registering as a member, you can increase the number of bookmarks you can save and organize them with labels.

Free membership registration

Comprehensive Catalog: System Products

A wide variety of unique and excellent system products handled by our company!

This catalog is a comprehensive introduction to the system products handled by Jupiter Technology Co., Ltd., which provides products that contribute to advanced security and business integrity. It features products such as the log server 'syslog-ng Store Box (SSB)', which achieves ultra-high-speed processing of up to 70,000 msg/s and is suitable for log management in enterprises and organizations where confidentiality and integrity are essential, as well as 'Safeguard for Privileged Sessions', which records all remote access operations in video format and is effective for security measures. [Featured Products] ■ Log Servers - syslog-ng Store Box (SSB) - WinSyslog - Kiwi Syslog Server, etc. *For more details, please download the PDF or contact us.

Added to bookmarks

Bookmarks list

Bookmark has been removed

Bookmarks list

You can't add any more bookmarks

By registering as a member, you can increase the number of bookmarks you can save and organize them with labels.

Free membership registration

Software "Atozed Software"

Offering three types of licenses: CrossTalk, IntraWeb, and Indy in Depth!

Atozed Software is software for developers. It provides tools such as "CrossTalk," which allows the use of .NET code and libraries in Delphi programs, and "IntraWeb," which is fully integrated into the Delphi platform. We also offer a book about the Indy library titled "Indy in Depth." 【Product Overview】 ■Type: Shareware ■Language: English *For more details, please refer to the related links or feel free to contact us.

  • Company:B7
  • Price:Other
  • Software (middle, driver, security, etc.)
  • soft

Added to bookmarks

Bookmarks list

Bookmark has been removed

Bookmarks list

You can't add any more bookmarks

By registering as a member, you can increase the number of bookmarks you can save and organize them with labels.

Free membership registration

Log compare for AccessMatrix UCM

Are you spending a lot of man-hours on log reconciliation work? Introducing a privileged ID management solution.

By introducing the privileged ID management product "AccessMatrix UCM" (hereinafter referred to as UCM), you can implement the application/approval of privileged ID passwords through a web-based workflow, and all of these histories will be saved as logs. However, there is no functionality to reconcile these logs with the logs of operations performed using privileged IDs. "Log compare for AccessMatrix UCM" is a privileged ID operational management solution that allows you to understand the usage status of privileged IDs and identify privileged IDs that are not managed by UCM by reconciling the logs of UCM with the logs of the systems managed by UCM. 【Main Features】 ■ Detection of unauthorized logins - Use of privileged IDs not managed by UCM ■ Detection of logins outside the designated period - Usage history of privileged IDs that deviated from the application period of UCM ■ Confirmation of logins within the designated period - Usage history during the application period by privileged IDs managed by UCM *For more details, please refer to the PDF materials or feel free to contact us.

  • Server monitoring and network management tools
  • Other security
  • soft

Added to bookmarks

Bookmarks list

Bookmark has been removed

Bookmarks list

You can't add any more bookmarks

By registering as a member, you can increase the number of bookmarks you can save and organize them with labels.

Free membership registration

Visualizing equipment abnormalities on the factory layout | CEW-M4 map display

Displays measurement values and alarm statuses on equipment layout diagrams and circuit diagrams. It supports the understanding of equipment and locations where abnormalities occur, as well as the efficiency of on-site verification.

When there are numerous devices and sensors within a factory, simply receiving an alarm may not allow for immediate judgment of the installation location of the target device or the surrounding conditions. Relying solely on the device name or sensor number for verification may require searching for diagrams or inquiring with personnel about the installation location, which can take time before on-site confirmation can occur. By utilizing the map display function of the monitoring software "CEW-M4," measurement values and alarm statuses can be displayed on any image, such as the factory layout, equipment arrangement diagrams, circuit diagrams, and photos of control panels. Since measurement values like current, power, energy, temperature, and humidity can be associated with the actual equipment locations, when an alarm occurs, the target equipment and installation location can be confirmed on the map, which can also help narrow down the equipment or areas that need to be checked on-site. [Challenges] Even when an alarm occurs, the installation location of the target equipment is not immediately clear. It is difficult to grasp the positional relationship with the site relying only on the device name or sensor number. [Effects of Implementation] Confirm the alarm-triggering equipment and installation location on the factory layout. Organize the monitoring screen clearly by associating measurement values with equipment locations. For more details, please download the PDF document or contact us.

  • Power Monitoring Equipment
  • Demand Monitoring
  • Server monitoring and network management tools
  • soft

Added to bookmarks

Bookmarks list

Bookmark has been removed

Bookmarks list

You can't add any more bookmarks

By registering as a member, you can increase the number of bookmarks you can save and organize them with labels.

Free membership registration

Centralized management of measurement data from multiple factories and standardization of verification methods.

Consolidate measurement data distributed across factories, buildings, and lines into a common web interface. You can standardize the management methods for history, alarms, and CSV files across locations.

When the methods of managing equipment data differ across multiple factories, buildings, and production lines, it takes time to check the situation at each site, compare periods, and create reporting data. "CEW-M4" aggregates data collected from sensors and measuring instruments at each site into a common web interface, allowing for management through lists, graphs, maps, alarm history, and CSV files. The monitoring software "CEW-M4" consolidates data from connected devices into a web interface, enabling list displays, comparisons, aggregations, history, CSV, and alarm management. [Challenges] - We want to unify the different verification methods at each site. - We want to centrally manage the history and alarms of multiple factories. - We want to streamline the creation of reporting data. [Benefits of Implementation] - Aggregation of measurement data from multiple sites to the web. - Standardization of history, alarms, and CSV management. - Increased efficiency in situation verification and report creation. You can check detailed features and screen examples in the downloadable materials. For more information, please download the materials or feel free to contact us.

  • Power Monitoring Equipment
  • Other machine tools
  • LAN construction and wiring work
  • soft

Added to bookmarks

Bookmarks list

Bookmark has been removed

Bookmarks list

You can't add any more bookmarks

By registering as a member, you can increase the number of bookmarks you can save and organize them with labels.

Free membership registration

Notify measurement values outside of set conditions and streamline history verification.

Supports alarm display and email notification based on upper and lower limit conditions. You can check the time series history before and after the notification on the same screen and organize the subjects for on-site verification.

When managing multiple devices and circuits, there are times when measurement values fall outside of set conditions, and it may be necessary to check the target device, occurrence time, and trends before and after from separate screens or records. "CEW-M4" allows you to set upper and lower limit conditions for the measurement values collected from connected devices, and can be utilized for alarm display, email notifications, alarm history, and time-series graphs. The monitoring software "CEW-M4" aggregates data from connected devices onto a web screen, enabling list display, comparison, aggregation, history, CSV export, and alarm management. 【Challenges】 - I want to quickly grasp values that fall outside of set conditions. - I want to continuously check the history before and after notifications occur. - I want to organize the devices and time periods for on-site verification. 【Benefits of Implementation】 - Alarm display and email notifications based on upper and lower limit conditions. - Centralized confirmation of history before and after notifications. - Organization of targets and time periods for on-site verification. You can check detailed functions and screen examples in the downloadable materials. For more information, please download the materials or feel free to contact us.

  • Sensors
  • Power Monitoring Equipment
  • Other Energy Saving
  • soft

Added to bookmarks

Bookmarks list

Bookmark has been removed

Bookmarks list

You can't add any more bookmarks

By registering as a member, you can increase the number of bookmarks you can save and organize them with labels.

Free membership registration